Using the Dashboard
The Dashboard is split into multiple sections. Each section provides statistics to help you better gauge how your shop is handling checklists.
Dashboard Filters
The top of the window includes the search criteria for the Dashboard.
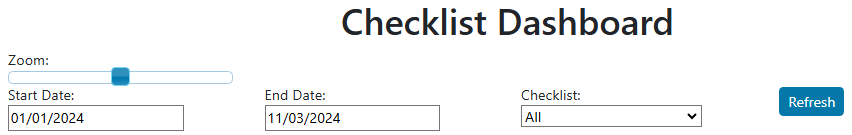
- Start Date and End Date - Enter the date range. By default, both dates are yesterday’s date.
- Checklist - Select a checklist in the dropdown list to see the statistics for one checklist.
- Refresh - Click to reload the statistics to search by new criteria.
- Zoom - Use the slider to make the text and graphics larger for better readability.
Reading the Bar Graphs
The bar graphs give you a visual representation of the checklist statistics.
First Row
The first row includes the following.
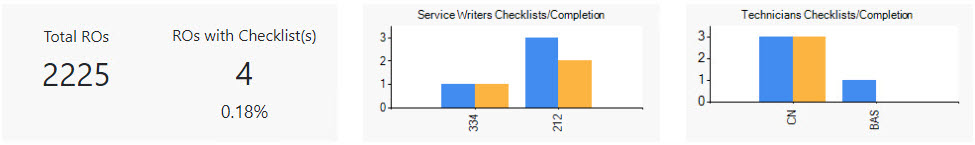
- Total ROs - The number of repair orders created.
- ROs With Checklists - The number of repair orders had checklists assigned to them.
- Service Writer Checklists Completion - Checklists opened and completed by service writers.
- The blue bar shows the number of checklists opened.
- The yellow bar shows the number of checklists completed.
- Service Writer Checklists Completion - Checklists opened and completed by technicians.
- The blue bar shows the number of checklists opened.
- The yellow bar shows the number of checklists completed.
Second Row
The second row includes the following.
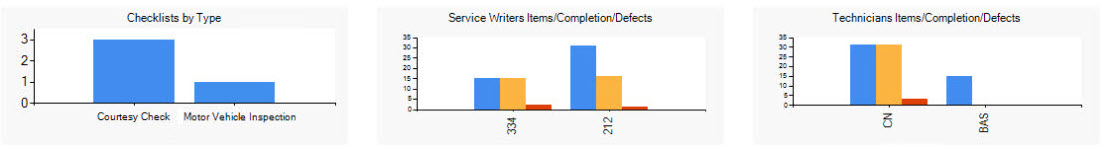
- Checklists by Type - The types of checklists that were opened.
- Service Writers Items/Completions/Defects - The number of items in checklists, the number completed, and the number of defects.
- The blue bar shows the number of items in all checklists.
- The yellow bar shows all completed items.
- The red bar shows all defects.
- Technicians Items/Completions/Defects - The number of items in checklists, the number completed, and the number of defects.
- The blue bar shows the number of items in all checklists.
- The yellow bar shows all completed items.
- The red bar shows all defects.
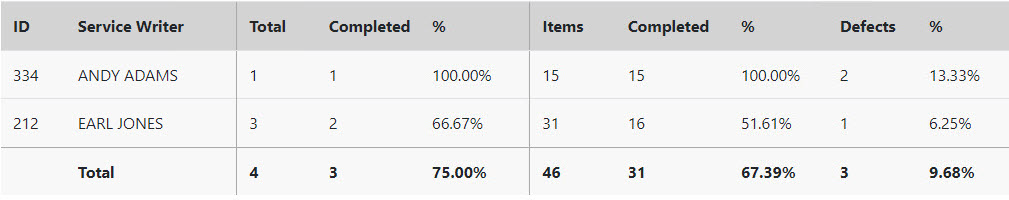
Checklists and Items Filtered By Service Writer
The statistics for the service writers are shown below the bar graphs.
|
Statistic |
Description |
|---|---|
|
ID |
The ID of the service writer. |
|
Service Writer |
The name of the service writer. |
|
Total (Checklists) |
The number of checklists opened by the service writer. |
| Completed (Checklists) |
The number of checklists completed by the service writer. |
| % (Checklists) |
The percentage of completed checklists opened by the service writer. |
| Items |
The number of items in the checklists opened by the service writer. |
| Completed (Items) |
The number of items in checklists that were completed by the service writer. |
| % (Items) |
The percentage of completed items in checklists opened by the service writer. |
| Defects |
The number of items that were marked as defective by the service writer. |
| % (Defects) |
The percentage of defective items in the checklists by the service writer. |
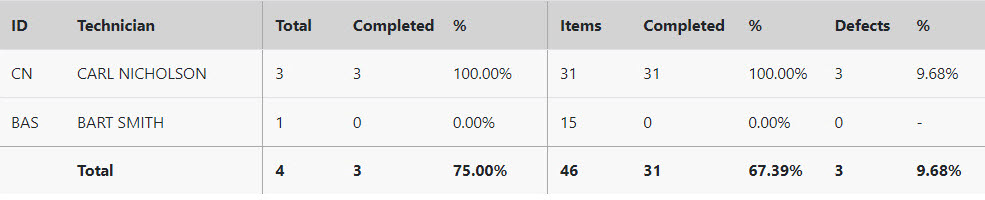
Checklists and Items Filtered By Technicians
The statistics for technicians are shown below the service writers.
|
Statistic |
Description |
|---|---|
|
ID |
The ID of the technician. |
|
Technician |
The name of the technician. |
|
Total (Checklists) |
The number of checklists opened by the technician. |
|
Completed (Checklists) |
The number of checklists completed by the technician. |
|
% (Checklists) |
The percentage of completed checklists opened by the technician. |
|
Items |
The number of items in the checklists opened by the technician. |
|
Completed (Items) |
The number of items completed by the technician. |
|
% (Items) |
The percentage of completed items by the technician. |
|
Defects |
The number of items that were marked as defective by the technician. |
|
% (Defects) |
The percentage of defective items in the checklists by the technician. |
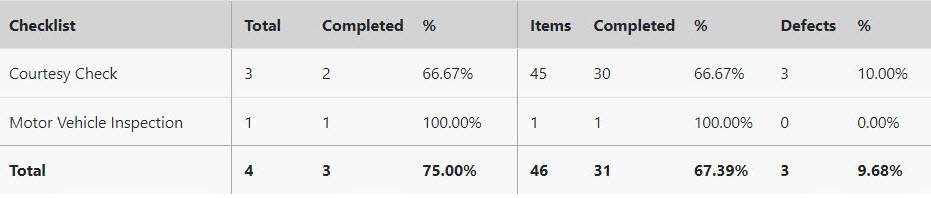
Checklists and Items Filtered By Checklist Type
The Checklists by Type are shown below the technician table.
|
Setting |
Description |
|---|---|
|
Checklist |
The name of the checklist type. |
|
Total (Checklists) |
The number of that checklist type opened. |
|
Completed (Checklists) |
The number of that checklist type completed. |
|
% (Checklists) |
The percentage of completion of that checklist type. |
|
Items |
The number of items that were in the opened in that checklist type. |
|
Completed (Items) |
The number of items that were completed in that checklist type. |
|
% (Items) |
The percentage of completion of items that were in that checklist type. |
|
Defects |
The number of items that were marked as defective in that checklist type. |
|
% (Defects) |
The percentage of defective items in that checklist type. |